Money Management in the Stock Market 2025
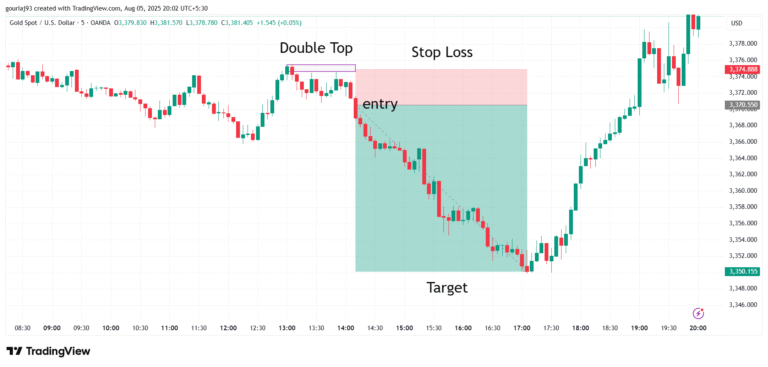
Effective money management is crucial for long-term success in the stock market, as it enables you to have a mathematical edge in risk management. Tools of Money Management: 1) Stoploss: Stoploss must be logical & maximum 0.8% up to 0.5%…