
Learn Trading with the Growth of India for Free and Discover the Stock Market’s trending Topics. Chart patterns are visual formations created by the price movements of a stock or other financial asset, typically displayed on candlestick charts. Here’s a breakdown of common chart patterns in stock trading, grouped by type.
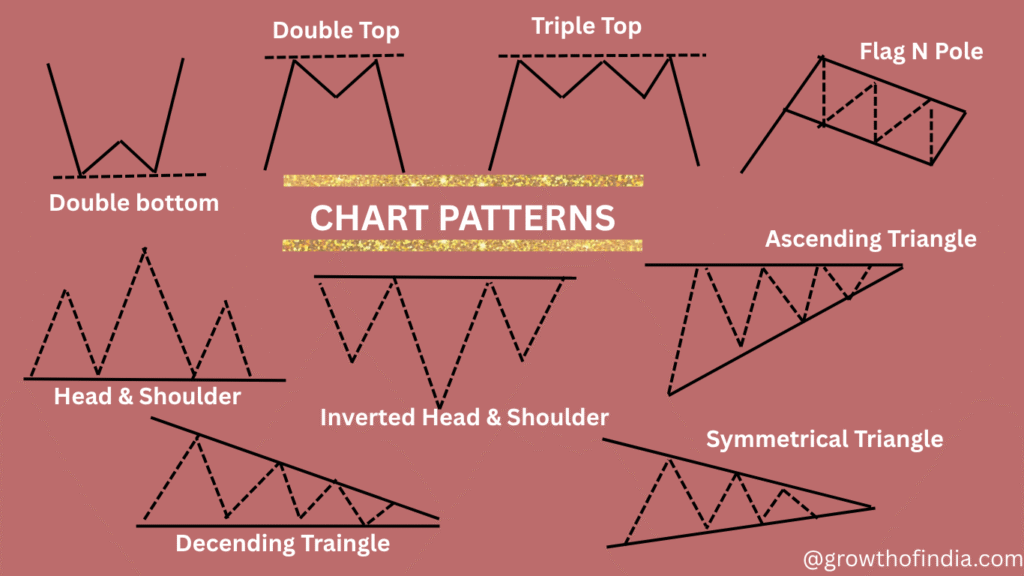
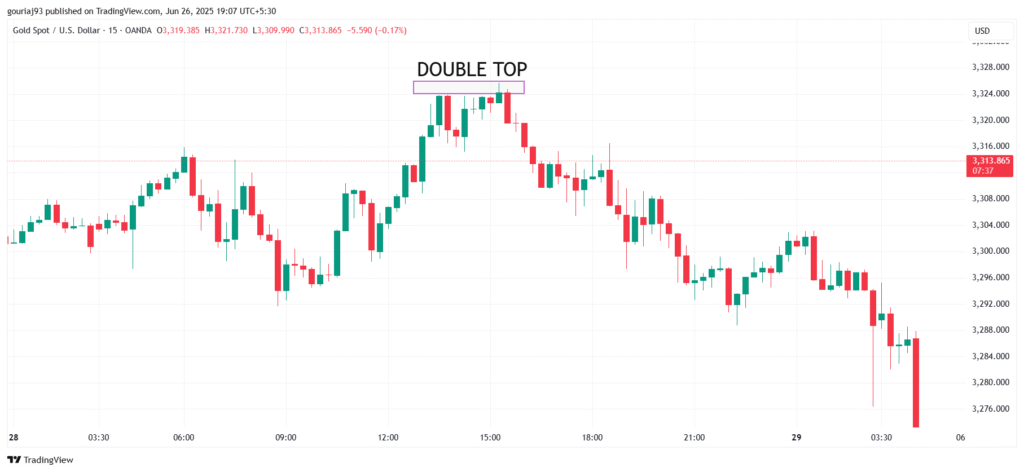
1) Double Top:
-Double Top: Price hits resistance twice – bearish reversal. (looks like “M”)
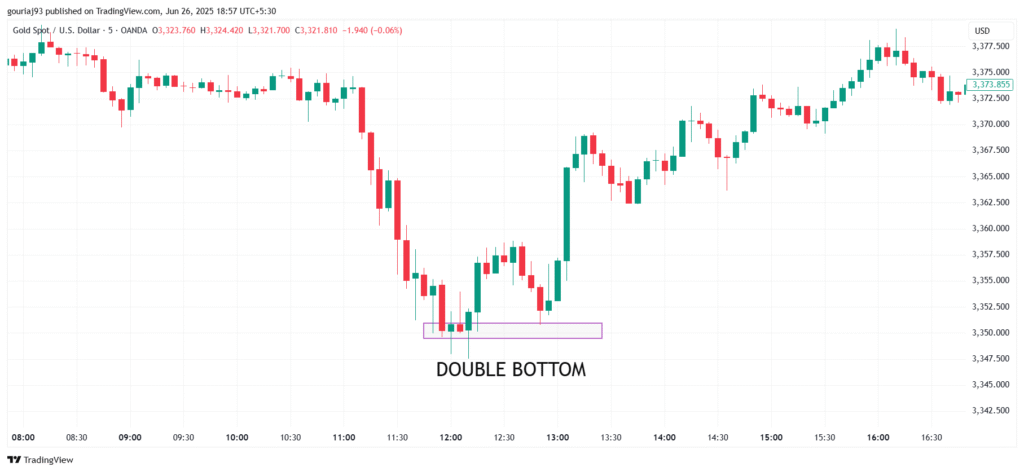
Double Bottom:
-Double Bottom: Price hits support twice – bullish reversal. (looks like “W”)
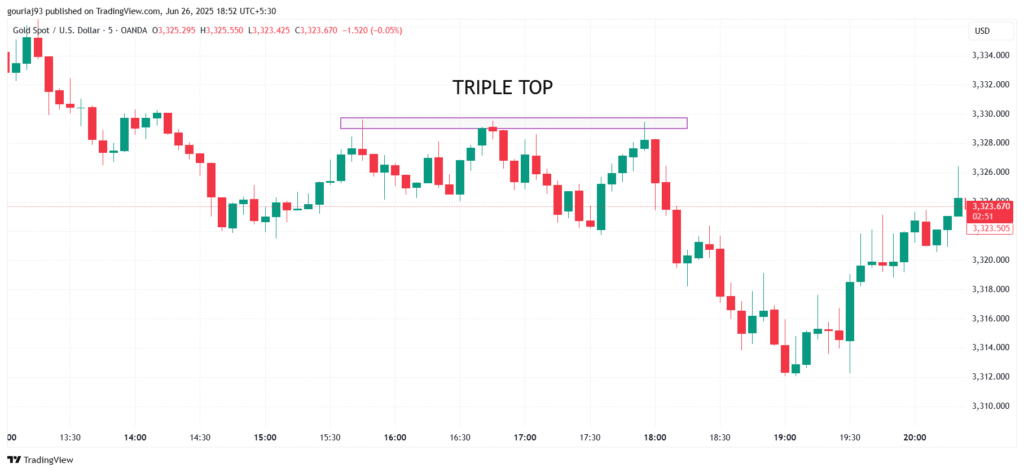
2) Triple Top / Triple Bottom
-Like the double versions, but with three touches.
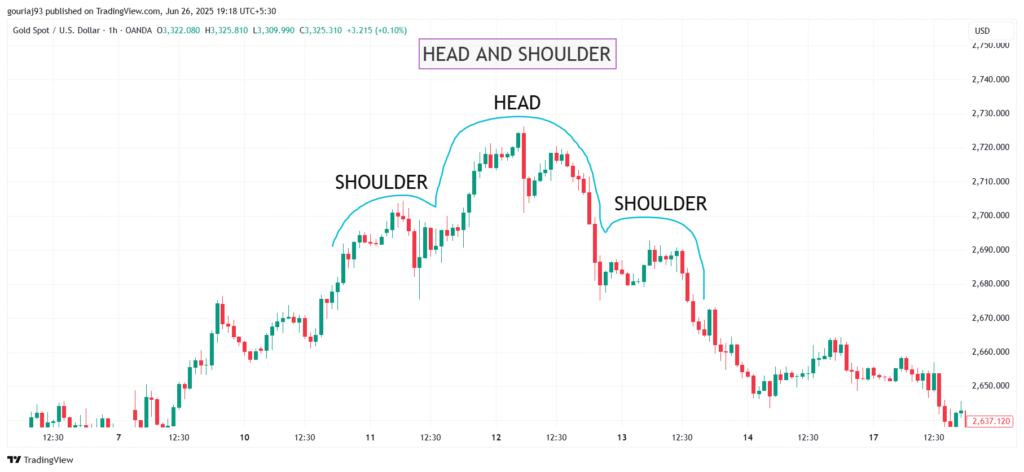
3) Head and Shoulders
-The market forms a head and shoulder pattern, which means the market is taking a reversal from Bullish to Bearish.
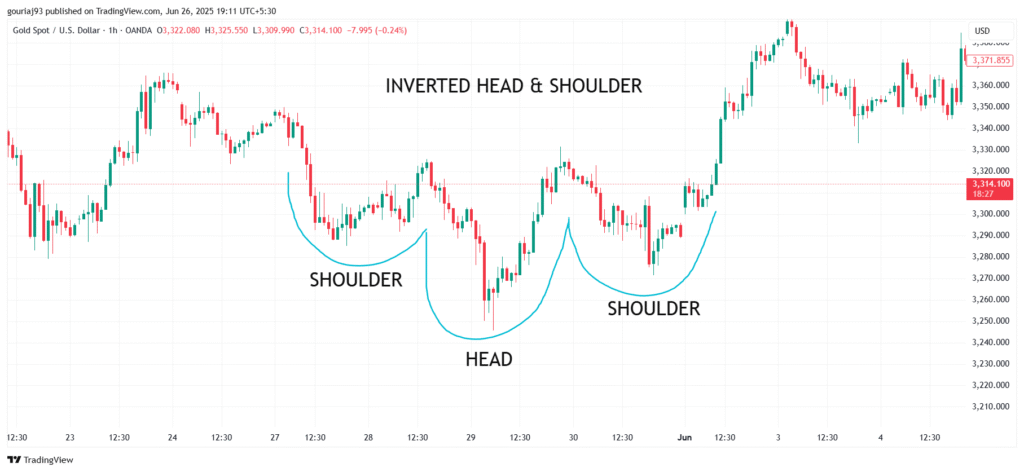
4) Inverted Head and Shoulders
-The market forms an inverted Head and Shoulders, which means the market is taking a reversal from Bearish to Bullish.
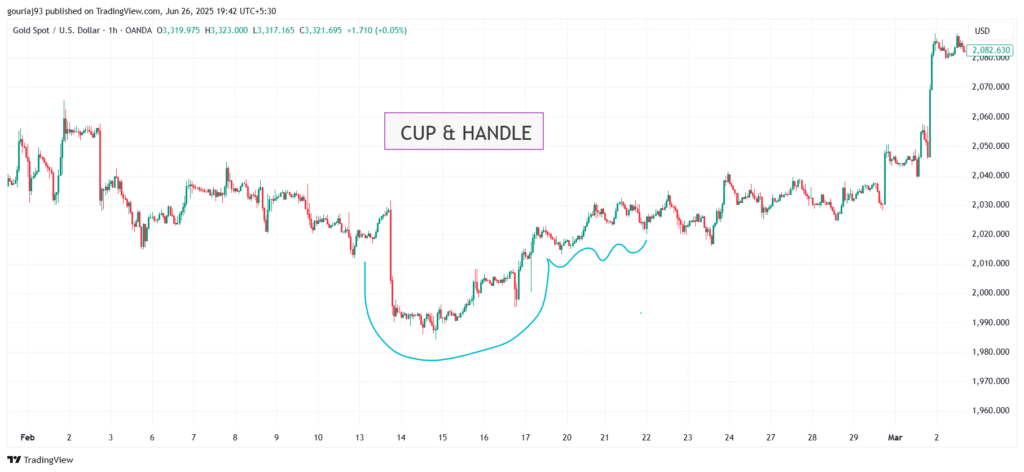
5) Cup and Handle
-It is a pattern that looks like a cup. price goes down and makes a consolidation, and again goes up, forming a cup pattern.
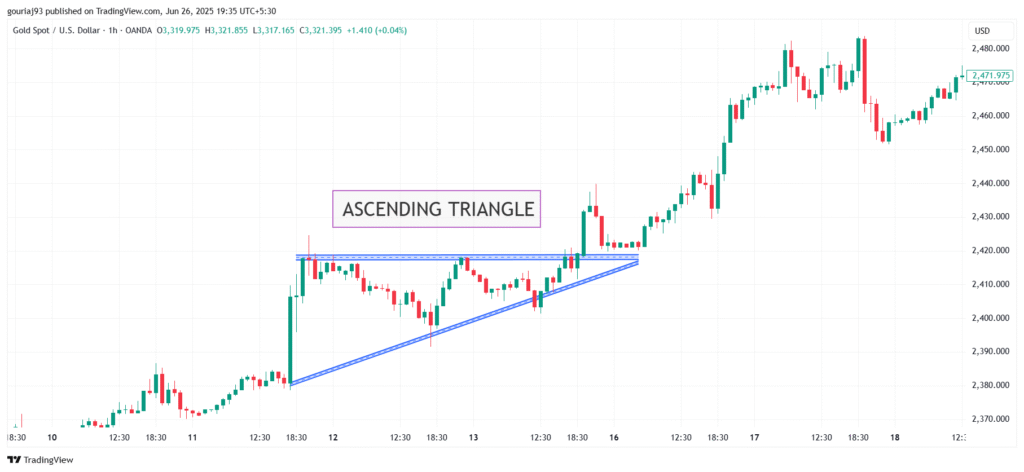
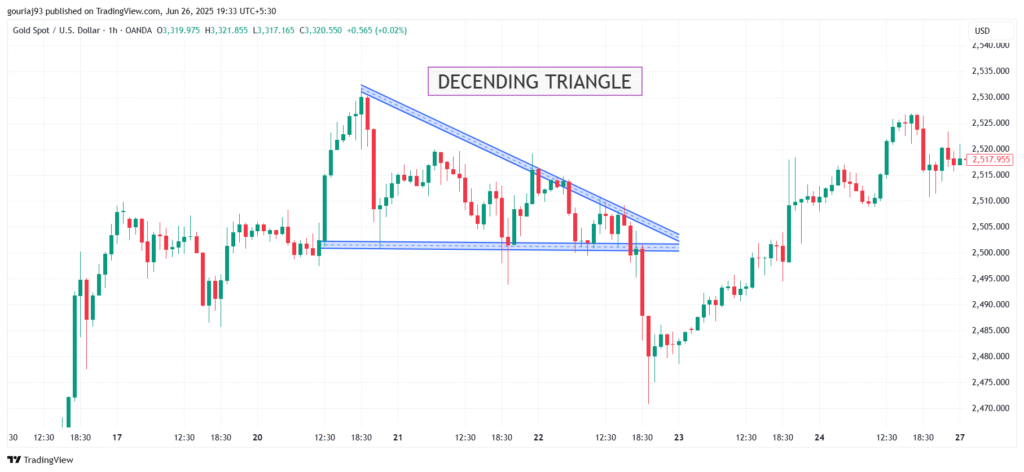
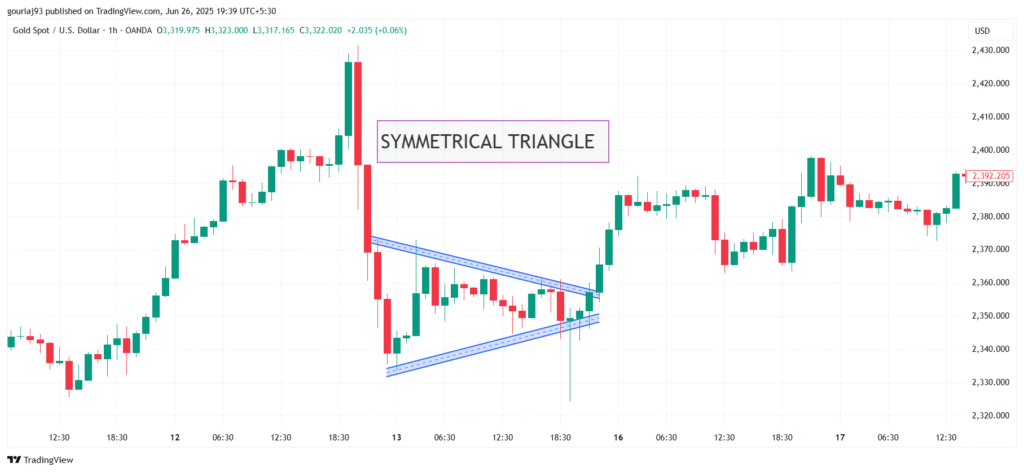
6) Triangles
*Ascending Triangle: Bullish, flat resistance + rising support.
*Descending Triangle: Bearish, flat support + falling resistance.
*Symmetrical Triangle: Neutral, price could break either way.
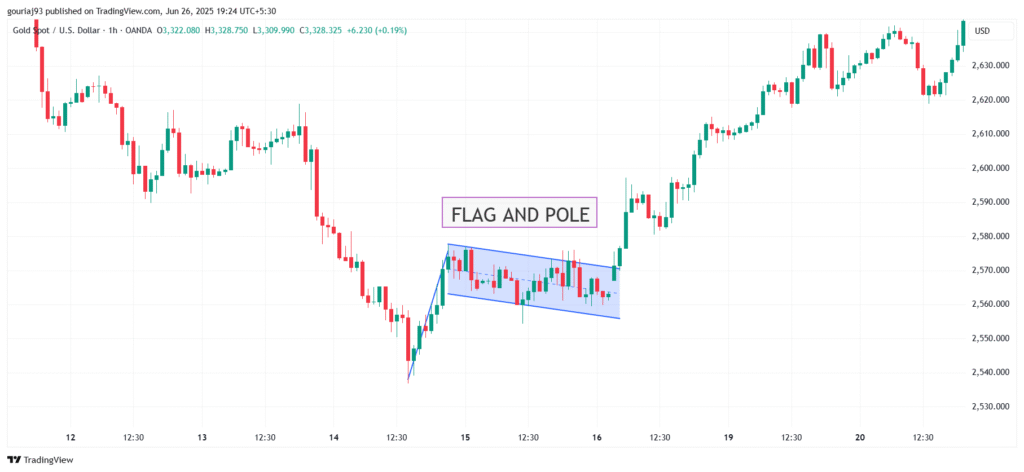
7) Flags n Pole Pattern
-It appears after a strong price move and looks like a Flag.
📈 Other Notable Chart Patterns
Wedges
Rising Wedge: Bearish, price moves up in a narrowing range.
Falling Wedge: Bullish, price moves down in a narrowing range.
⚠️ Key Tips for Using Chart Patterns
Use with indicators: RSI, MACD, and moving averages can help confirm patterns.
False breakouts: Be cautious — always set stop-losses.
Time frame matters: Patterns on longer time frames (daily/weekly) are more reliable.
The above information is provided for educational purposes only. We hope you liked it., For more related blogs follow us @growthofindia.com