
1. What is a Candlestick Chart?
A candlestick chart shows a stock’s price movement over a certain period.
This type of chart is used by traders because they are easy to read and
understand.
2. What are the components of a candlestick?
A candlestick can show you a lot of information in a simple manner. Each
candlestick is made of a body and wicks (thin lines extending above and below the
body).
A typical candlestick looks like this:
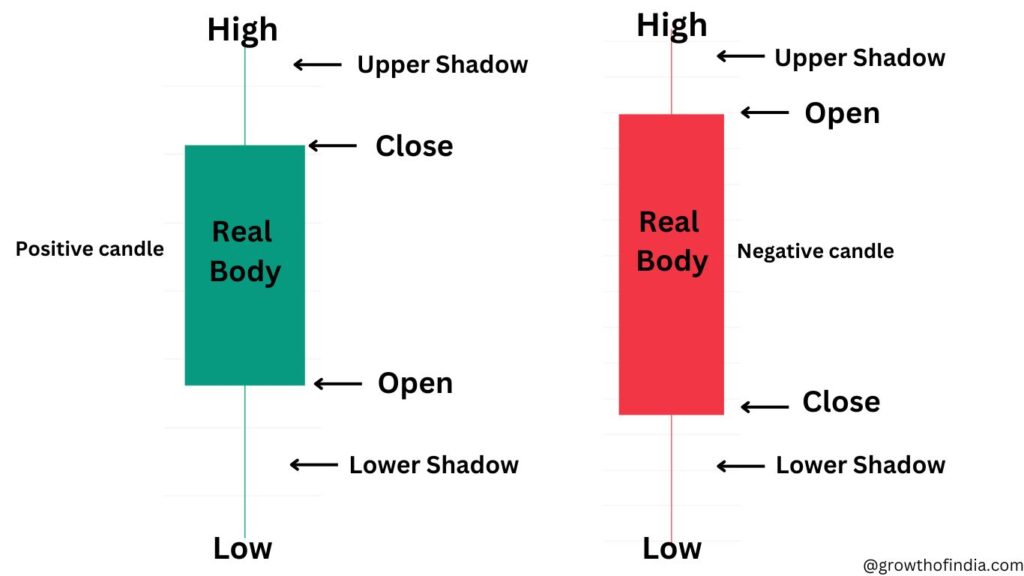
- A GREEN candlestick is formed if the close is above the open.
- A RED candlestick is formed if the close is below the open.
- The space between the open and closed points is called the ‘BODY”
- The thin lines that extend from the top and the bottom are known as wicks or shadows.
- The top of the upper wick represents the ‘HIGH’
- The bottom of the lower wick represents the ‘LOW’,
3. How to read a candlestick chart?
A candlestick chart includes the open, closed, high, and low prices of a stock over
a specific time frame. This time frame can be changed and set by the trader as per
his requirement.
For example, if the time limit is fixed at ten minutes, then a new candlestick is
created in the graph every ten minutes Then, by simply looking at the chart, the trader can find out all four major price movements of the stock over a particular time frame.
4. Candlestick chart analysis
*It is important that candlesticks should not be observed in isolation. The
context (past patterns) is very crucial when it comes to candlestick
analysis.
*The trader must observe the previous candlesticks and observe how
they have changed over time.
*Has the body of the candlestick become larger or smaller? What about
the wicks (shadows)? How have they changed?
* These are the questions the trader must ask himself as he analyses the
candlestick chart.
*This is because when the rea| body of the candlestick becomes larger, it
indicates an increase in momentum.
*The body of the candle shows how much the price of the stock has
changed throughout the time frame.
* A long white candlestick represents bullish strength while a long black
candlestick represents bearish strength in the market.
Engulfing and Hammer Candlesticks Details.
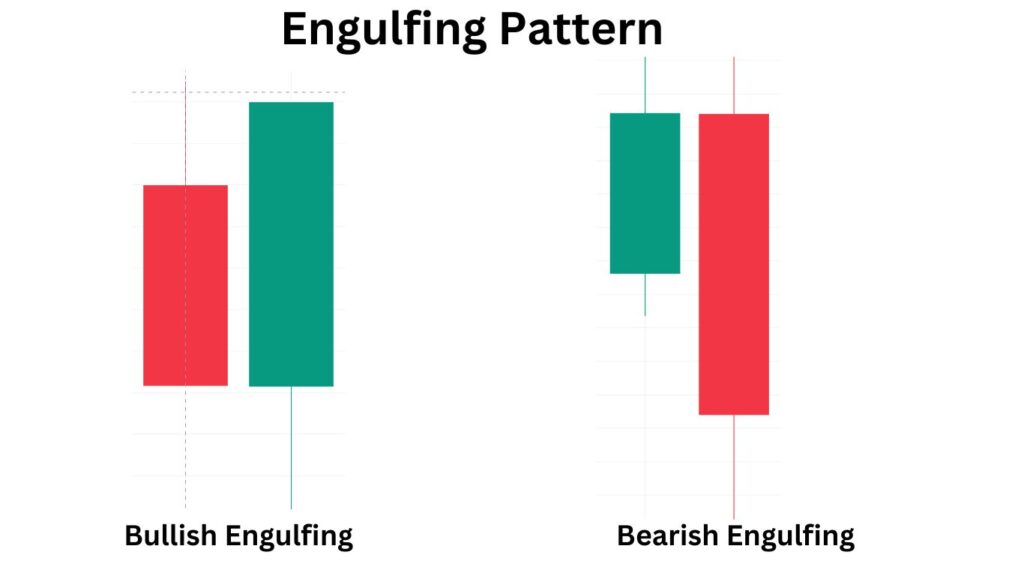
5. What is Engulfing Pattern?
Engulfing candlestick patterns are made of two bars on a price chart. They are
used to indicate a market reversal. The second candlestick will be much larger than
the first SO in that it completely covers or ‘engulfs’ the length of the previous bar.
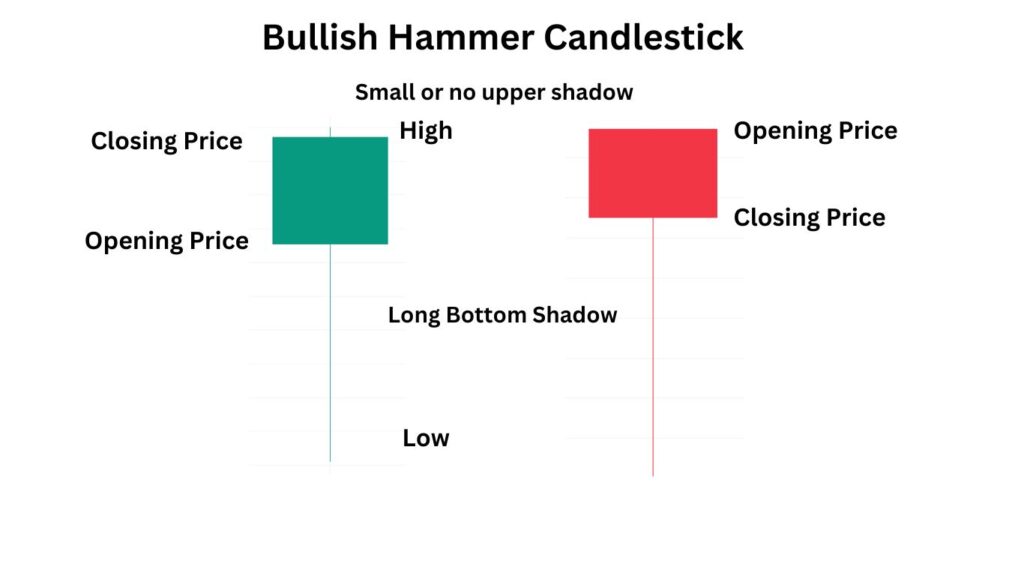
6. What is a Hammer pattern?
The hammer candlestick pattern is formed of a short body with a long wick. A
hammer shows that although there were selling pressures during the day,
ultimately strong selling/buying pressure drove the price back up/down.
7. What is a Bullish Hammer pattern?
The hammer candlestick pattern is formed of a short body with a long lower wick
and is found at the bottom of a downward trend.
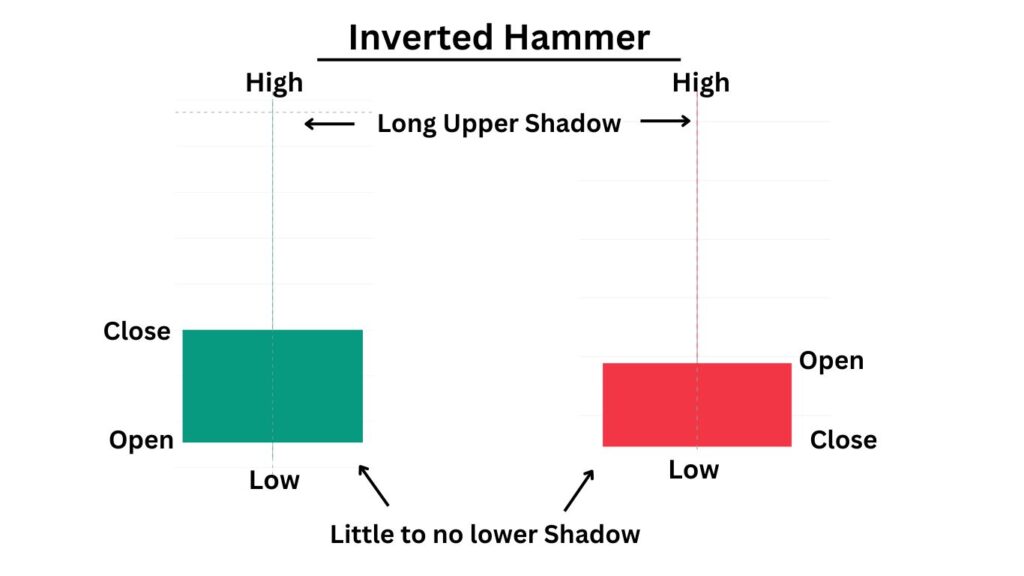
8. What is a Bearish Hammer pattern?
The hammer candlestick pattern is formed of a short body with a long upper wick
and is found at the top of an uptrend trend.
9. What is Lower Price Rejection?
Lower price rejection can be said when the price takes rejection from the lower level forming a bullish hammer or any bullish candle.
10. What is a Higher Price Rejection?
Higher price rejection can be said when the price takes rejection from a higher level
forming an inverted hammer or any bearish candle.
11. Why is a Bullish Hammer red?
A bullish hammer doesn’t depend on the color of the candle. What matters is the
long wick below the body of the candle.
12. Why is a Bearish Hammer green?
The bearish hammer doesn’t depend on the color of the candle. What matters is the
long wick above the body of the candle.
13. What is Reversal Pattern?
There are many reversal patterns like a shooting star, morning star, piercing line,
etc. These patterns indicate a change in the trend of a stock and the stock is likely
to move in the opposite direction.
14. What is Doji?
Standard Doji is a single candlestick whose open and close price is at the same level. This
candle does not signify much on its own just shows that confusion has been created in the
market. To understand what this candlestick means, traders observe the prior price action
building up to the Doji
15. What is simple Doji?
A Standard Doji is a single candlestick whose open and close price is at the same level.

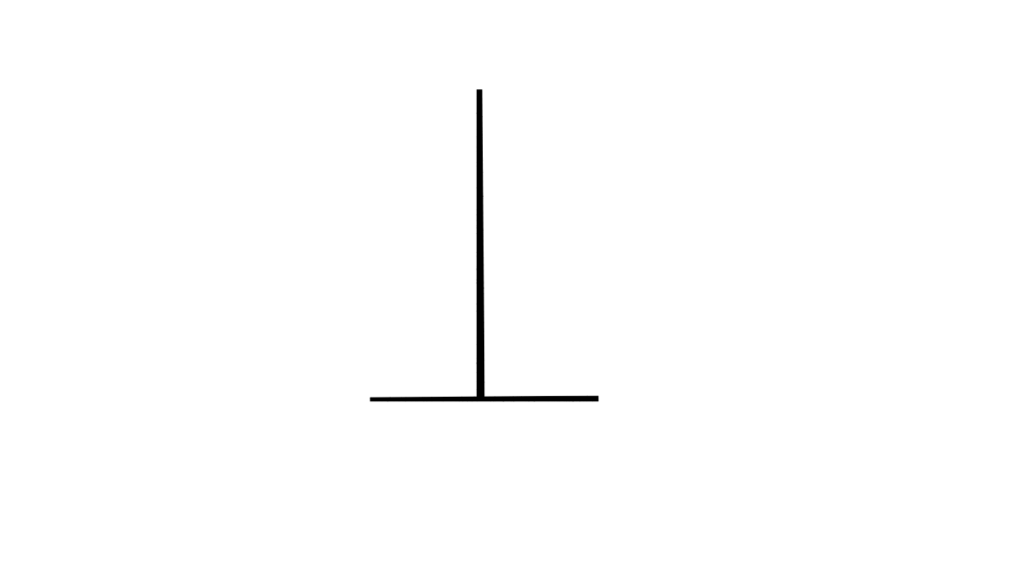
16. What is Gravestone Doji?
The Gravestone Doji is the opposite of the Dragonfly Doji. It appears when price
action opens and closes at the lower end of the trading range. After the candle
opened, buyers were able to push the price up but by the close, they were not able
to sustain the bullish momentum. At the top of a move to the upside, this is a
bearish signal.
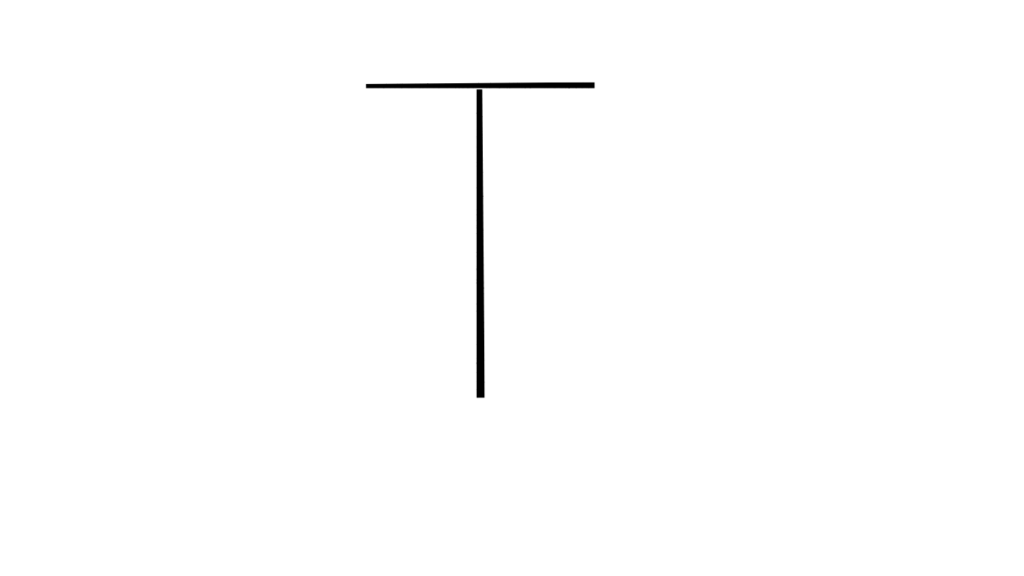
17. What is Dragonfly Doji?
The Dragonfly Doji can appear at either the top of an uptrend or the bottom of a
downtrend and signals the potential for a change in direction. There is no one
above the horizontal bar which creates a T shape and signifies that the price did not
move above the opening price. A very extended lower wick on this Doii at the
bottom of a bearish move is a very bullish signal.
The above information is only for educational purposes, we hope it is useful for you for more related blogs follow us on @growthofindia.com