
Learn Trading with the Growth of India for Free and Discover the Stock Market’s trending Topics
1)What is a Retest?
In the stock market, a retest refers to testing a price zone again after the price has already broken through (support, resistance), which is known as a retest.
🔁 What Retest Means
After a breakout or breakdown, the price often comes back to the same level to “retest” it before continuing in the original direction.
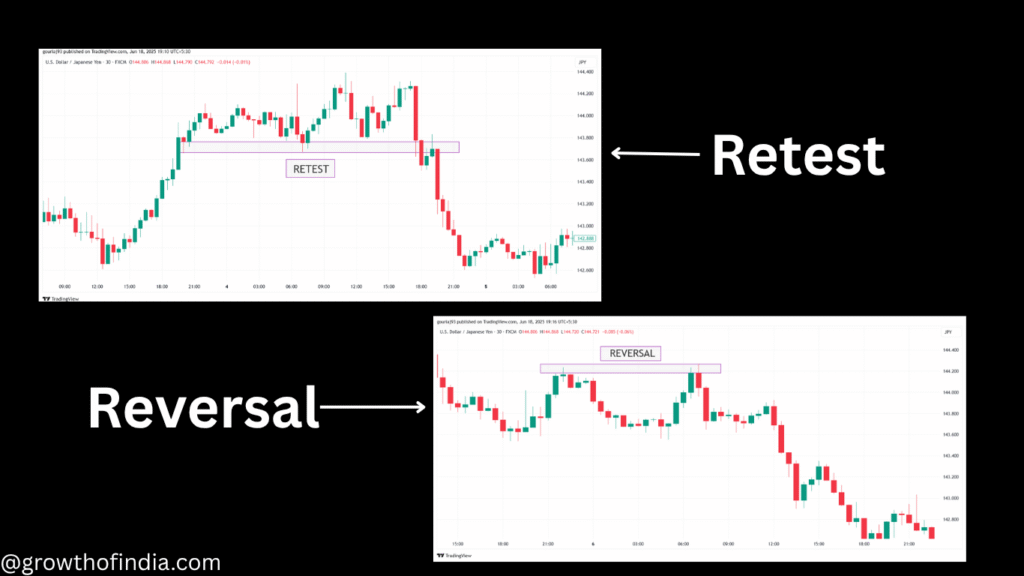
There are two common types: Retest and Reversal
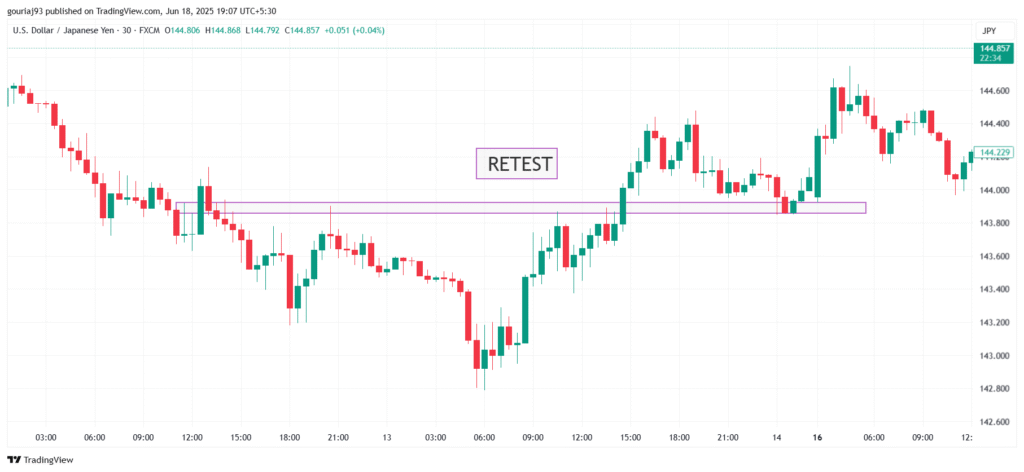
1. Retest After Breakout (Bullish Retest)
- A resistance level is broken (price goes above it).
- Then, price comes back down to the same level to test if it has now become support.
- If it holds and bounces, it confirms the breakout is strong.
Example:
- Resistance at ₹100 is broken, price goes to ₹110.
- It then falls back to ₹100 — this is the retest.
- If it bounces from ₹100 again, it’s a bullish sign.
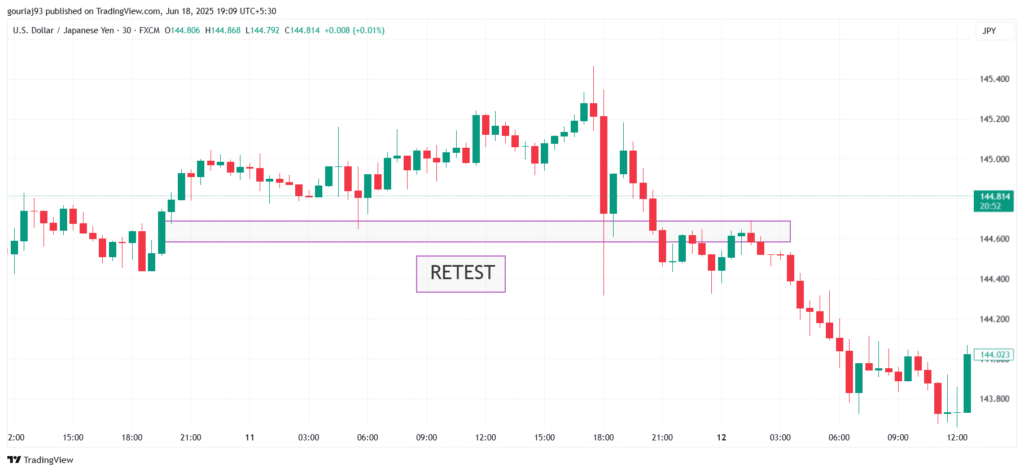
2. Retest After Breakdown (Bearish Retest)
- A support level is broken (price falls below it).
- Then, price moves back up to test that level from below.
- If it fails to break back above and falls again, it confirms the breakdown.
Example:
- Support at ₹500 is broken, price falls to ₹470.
- Then rises back to ₹500 — this is the retest.
- If it fails to go above ₹500 and falls again, it’s a bearish confirmation.
✅ Why Retests Matter
- Confirms the validity of a breakout or breakdown.
- Helps traders enter with more confidence after the test.
- Reduces the chance of false breakouts.
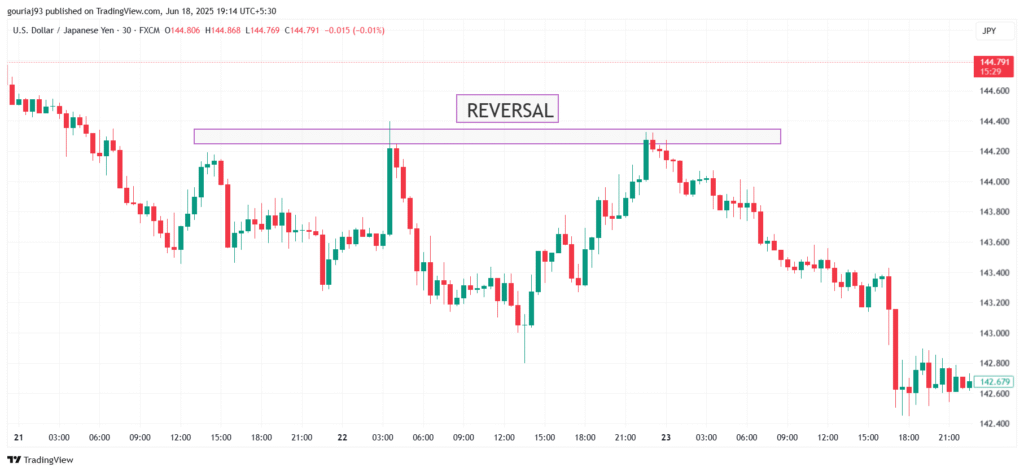
2)What is Reversal?
In the stock market, a Reversal refers to when there is a change in the direction of price in stock or index is known as Reversal.
There are two main types of reversals:
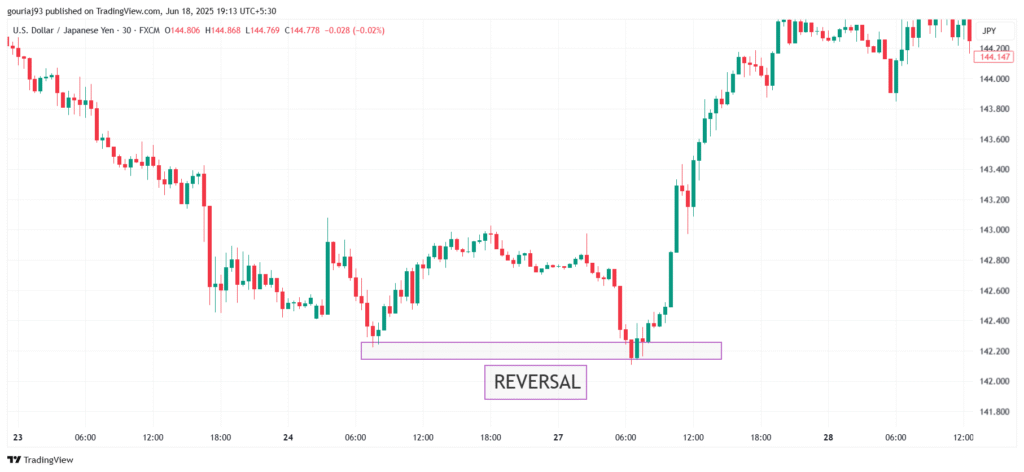
1. Bullish Reversal
- Happens when a downtrend changes into an uptrend.
- It indicates that the price, which was falling, has likely hit a bottom and is starting to rise.
- Example: A stock falling from ₹500 to ₹420 starts rising again and crosses ₹450 — this may signal a bullish reversal.
2. Bearish Reversal
- Happens when an uptrend changes into a downtrend.
- It means the price, which was rising, has likely peaked and is starting to decline.
- Example: A stock rising from ₹100 to ₹180 starts dropping and breaks below ₹150 — this could signal a bearish reversal.
🔍 How Reversals Are Identified
- Reversals are identified using indicators like Moving Averages, RSI (Relative Strength Index), and MACD.
- Chart patterns like Double Top/Bottom, Head & Shoulders, Engulfing Candles.
- Volume analysis: A reversal often comes with high trading volume.
This information is only for educational purposes. We hope you like this. For more related blogs, follow us at @growthofindia.com