FAQ on Trendline 2025

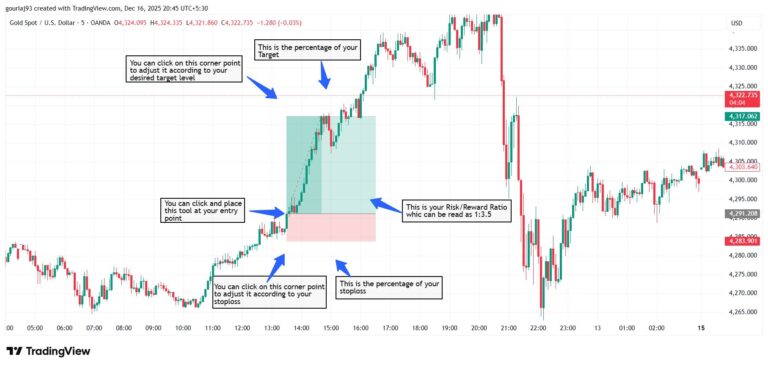
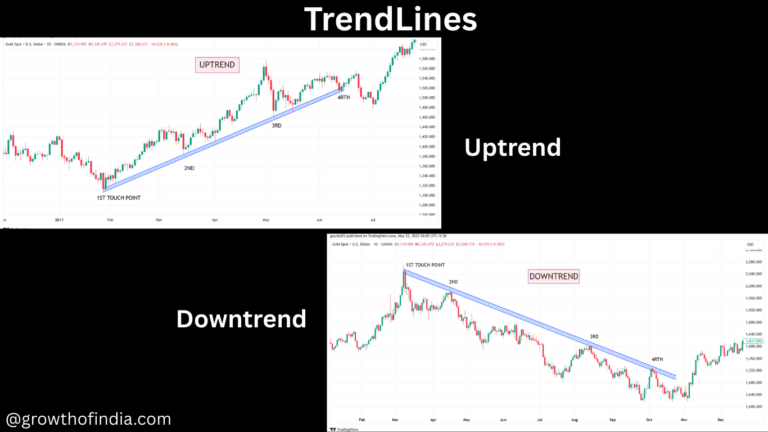
Trend lines are rare and strong. They are drawn using higher lows in an uptrend and lower highs in a downtrend. A good trend line has a maximum of multiple points touching both the wick and candle body combined. Types…
Career And Education – Blogs about the career choices and education streams that will help our audience to make the career decisions on career and education paths.
Trend lines are rare and strong. They are drawn using higher lows in an uptrend and lower highs in a downtrend. A good trend line has a maximum of multiple points touching both the wick and candle body combined. Types…
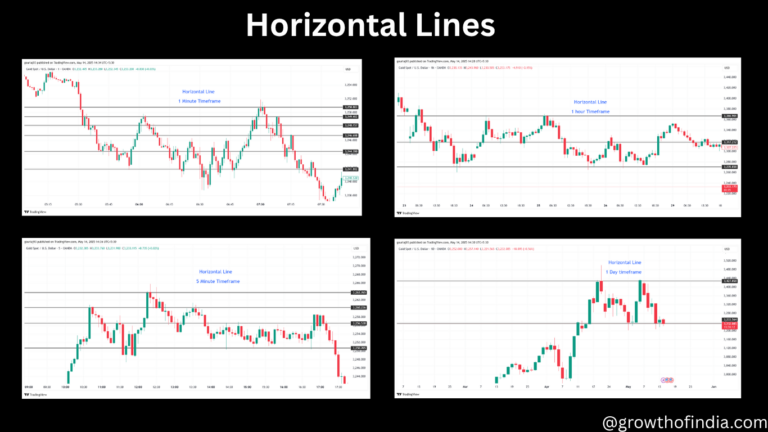
Horizontal Lines based on different Timeframes. we hope you got some knowledge on the above the information for more related blogs follow us on growthofindia.com
*Multiple timeframes analysis in trading when and how to watch: FAQ’S on Multiple Timeframe Analysis in Trading. 1) Which timeframe is the most important one that we should look at? Answer= 5 Minutes, 15 Minutes, 30 Minutes, 1Hour, 4Hours, 1Day,…
There are many types of trends in the market such as, *Uptrend– When the price moves up overall (with a little downward movement while going up), higher highs and higher lows are formed in an uptrend. *Downtrend– When the price…
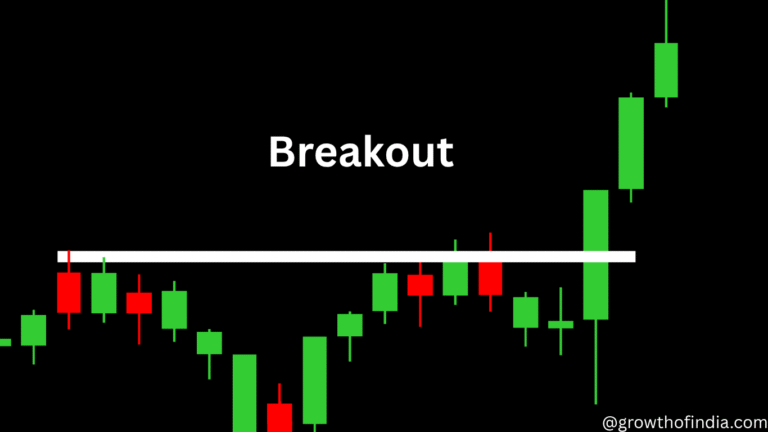
Support and Resistance: * When the price approaches an important level from below it is called Resistance. * When the price approaches an important level from above it is called Support. * When resistance is broken with power it becomes…
Market Structure: In trading, market structure refers to the overall framework of price movements on a chart, helping traders understand trends, key levels, and potential future price movements. It consists of several key elements: * Trends (Directional Movement) Types of…
1. What are red and green candlestick patterns? Red and green candlestick patterns are used in technical analysis to represent price movements in financial markets, particularly in stocks, forex, and cryptocurrencies. Green Candlestick (Bullish Candle): Indicates that the closing price…
Following are the Candlestick Pattern with Images. 1. What is the Piercing line? A piercing pattern is a two-day candlestick formation that signals a potential short-term reversal from a downtrend to an uptrend. It consists of a first-day candlestick that…
1. What is a Candlestick Chart? A candlestick chart shows a stock’s price movement over a certain period. This type of chart is used by traders because they are easy to read and understand. 2. What are the components of…
Below are the Nifty Sector Companies. 1. Automobile Industry Security Name & Weightage (%) Bajaj Auto Ltd 0.55 Hero MotoCorp Ltd 0.46 Eicher Motors Ltd. 0.58 Mahindra & Mahindra Ltd 1.69 Maruti Suzuki India Ltd 1.52 Tata Motors Ltd 1.04…